Mermaid Chart

Mermaid Chart is a fancy diagramming tool that allows users to create a range of diagrams using a text-based approach. Built on top of the open-source Mermaid.js, it simplifies the process of creating flowcharts, sequence diagrams, and many other types of visual representations. Users can define their diagrams in a Markdown-like syntax, which the tool converts into professional diagrams. This then allows for quick edits, making Mermaid Chart useful for developers who want to document code or business professionals visualizing workflows.
Mermaid Chart’s Visual Editor provides a click-and-drag interface for users who prefer a more graphical approach. It works in tandem with the text-based system, allowing users to switch seamlessly between code and visual editing. And it is this dual functionality that makes the tool accessible to both developers who enjoy writing diagram definitions and non-technical users who prefer a more intuitive, visual method.
Mermaid Chart also offers a collaboration feature for teams, allowing multiple users to work on the same diagram simultaneously. This can be particularly useful in professional environments where teams need to share and iterate on complex processes, such as in project management or product roadmapping.
In addition, Mermaid Chart includes customization options like themes and interactive elements, giving users flexibility in how they present their data. Plus, it integrates with other platforms, including documentation sites and development tools, enhancing workflows for businesses, educators, and developers alike.
So, if you need to create a fancy diagram with the help of AI, now you know where to look. Check it out.
Video Overview ▶️
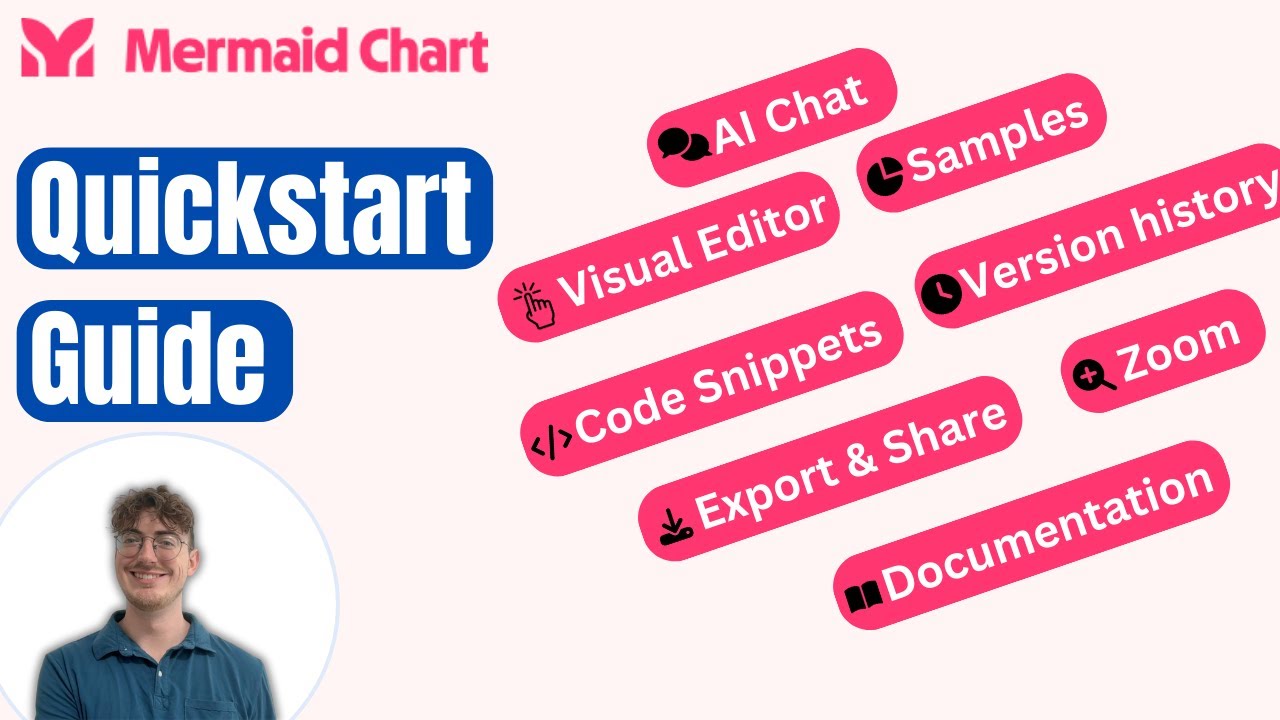
What are the key features? ⭐
- Text-based diagram creation: Easily create complex diagrams using simple text commands.
- Different diagrams: Mermaid Chart supports a range of diagram types, including flowcharts, sequence diagrams, Gantt charts, and more.
- Real-time updates: Automatically generates and updates diagrams as you modify the text.
- Easy integration: Mermaid Chart can be embedded into websites, markdown files, and various documentation tools.
- Customizable visuals: Users can customize the appearance and style of diagrams for clarity and presentation.
Who is it for? 🤔
Examples of what you can use it for 💭
- Simplify complex system architecture and workflows for software teams
- Create Gantt charts and process flows to manage project timelines
- Design interactive learning materials with visual aids
- Add dynamic diagrams to web pages or blogs for better illustration
- Enhance reports and presentations with clear, professional visuals
Pros & Cons ⚖️
- Easy to create diagrams from text
- Works with various IDEs and code repositories
- Support for team interaction and feedback
- It could take some time to master it