Gantt Chart AI


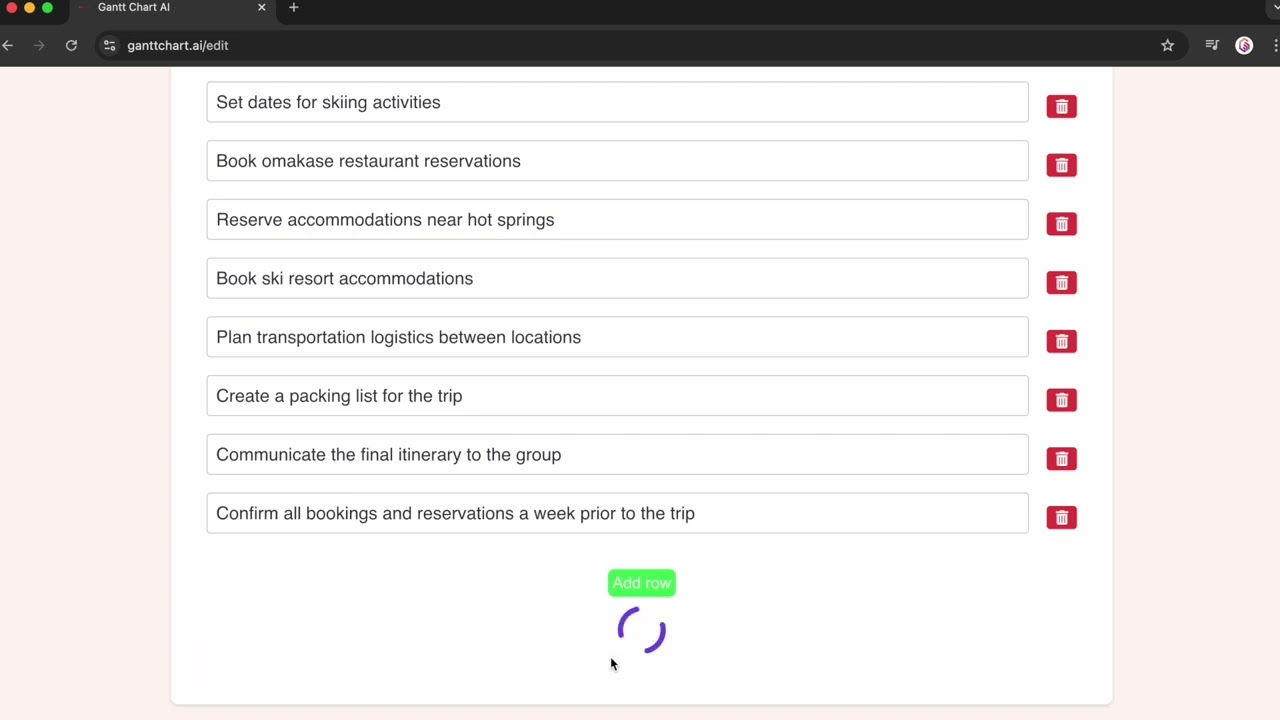
Gantt Chart AI is an online tool that creates Gantt charts from natural language descriptions of projects. It generates timelines with tasks, durations, dependencies, and milestones in seconds. The interface requires users to input project details in text form, after which the AI processes and visualizes the schedule.
Key integrations include Jira for importing epics, stories, and tasks, which auto-populates descriptions, teams, and scopes. Team assignments balance automatically based on imported data. Timelines regenerate when Jira updates occur. Google Sheets support allows editing and sharing charts in spreadsheet format, with Excel export options available.
The dashboard provides access to previous charts for download and management. Export formats include Excel files that retain structure for further editing. Pricing operates on a credit system, with two free credits for initial use and packs of 100 credits for ongoing needs. Premium features unlock with paid credits.
Competitors such as ClickUp offer broader project management with AI Gantt generation but require subscriptions. Tom’s Planner provides AI assistance in templates yet focuses more on manual adjustments. Gantt Chart AI excels in speed for simple visualizations but lacks advanced resource forecasting found in fuller suites.
Users report quick setup as a strength, with charts ready for presentations immediately. Limitations include occasional inaccuracies in complex dependency parsing, requiring manual corrections. For best results, provide detailed prompts with specific dates and sequences. Start with free credits to evaluate fit for sequential projects like events or launches.
Video Overview ▶️
What are the key features? ⭐
- Natural Language Input: Users describe projects in everyday text, and the AI generates complete Gantt charts with tasks and timelines automatically.
- Jira Integration: Imports epics, stories, and tasks from Jira to auto-fill project details, balance teams, and regenerate timelines based on updates.
- Google Sheets Editing: Allows creation and modification of charts directly in Google Sheets for familiar spreadsheet workflows and collaboration.
- Excel Export: Downloads charts in Excel format while preserving dependencies and formatting for offline use and further analysis.
- Dashboard Access: Stores and retrieves all created charts for easy management and reuse without recreating from scratch.
Who is it for? 🤔
Examples of what you can use it for 💭
- Freelance Writer: Describes novel outline with chapter deadlines and dependencies to generate a Gantt chart for pacing revisions and submissions.
- Event Planner: Inputs wedding schedule details like venue booking before catering to create a visual timeline shared with vendors via Sheets.
- Software Developer: Imports Jira tasks for a startup launch, auto-balancing team loads to track sprints and milestones in real time.
- Home Renovator: Outlines project phases from demolition to finishing, exporting the chart to Excel for contractor reviews and adjustments.
- Research Coordinator: Details biology study timeline with lab work sequences, using the dashboard to update and access progress charts ongoing.
Pros & Cons ⚖️
- Fast chart generation
- Easy Jira import
- Sheets integration
- Affordable credits
- Simple interface
- Limited free tier
- Dependency errors