logo-darklogo-darklogo-darklogo-dark
  • Tool Categories
    • 🎨Art & Creative Design505
    • 🏢Business Management644
    • 💻Coding & Development515
    • 👮Detection83
    • 🧠General Use727
    • 🏥Health & Wellness55
    • 📷Image & Photo Analysis100
    • 🖼️Image Generation & Editing618
    • 📐Interior & Architectural Design37
    • 🎓Learning & Education483
    • ⚖️Legal & Finance90
    • 🎭Lifestyle & Entertainment236
    • 📢Marketing & Advertising627
    • 🎧Music & Audio138
    • 👔Office & Workplace1,014
    • 🔬Research & Data Analysis372
    • 👥Social Media245
    • 🎥Video Generation & Editing426
    • 👧🏻Virtual Companion135
    • 🎤Voice Generation & Editing381
    • ✍️Writing & Editing808
    • All Categories
    • AI Use Cases
  • News
  • Events
    • Academic Conferences
    • Developer Conferences
    • Expos / Trade Shows
    • Industry Summits
    • Workshops / Training
    • All Events
    • Past Events
  • Saved Tools
  • Suggest a Tool
✕
Home › Art & Creative Design › Infographic Generation› Text2Infographic
Text2Infographic

Text2Infographic

Transforms text into professional infographics in minutes

Text2Infographic is an AI tool that generates infographics from text inputs, URLs, or uploaded files in about two minutes. It automates research, image selection, layout design, and citations to produce professional visuals suitable for blogs, social media, and presentations. The platform supports over 20 languages and allows post generation customization of colors, fonts, images, and logos.

Users receive two to three free credits upon signup for testing, with a lifetime access pass available for unlimited use. This setup contrasts with traditional design processes that take nine hours and cost around $315 per project, reducing time and expense by 99 percent. Key inputs include text descriptions, blog links, spreadsheets, or documents, which the AI parses for hierarchies, lists, and data to structure into charts, timelines, or diagrams. Outputs are static infographics optimized for sharing, with auto sourced copyright free images and embedded sources for credibility.

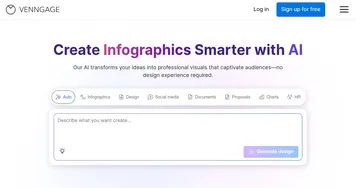
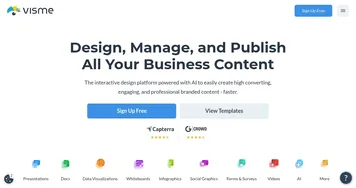
Compared to competitors, Venngage emphasizes data driven templates but requires subscriptions starting monthly, while Text2Infographic offers one time payment for full access. Visme provides interactive elements and broader content types like presentations, yet its ongoing fees exceed the lifetime model here. Piktochart focuses on quick topic based creation with credit limits on free tiers, differing from unlimited generations post purchase in Text2Infographic.

Users appreciate the simplicity for non designers, with testimonials highlighting time savings for bloggers and educators creating social content or lesson materials. The tool integrates brand elements and commercial rights, supporting professional applications. Limitations include potential generic initial designs needing edits for specificity and no refunds on credits, though feedback mechanisms allow improvements.

Technical aspects involve an intelligent parsing engine that detects content structures and applies context matched themes. For global users, multilingual generation ensures versatility. Practical steps include signing up for free credits, inputting concise content for best results, and refining outputs before export to maximize utility.

Visit Text2Infographic ↗
Categories
🎨 Art
📊 Infographic Generation 🖌️ Graphic Design 🖼️ Design Generation
🖼️ Image
🪄 Text to Image 🖼️ Image Generation
👔 Work
📈 Charting 💬 Presentation Generation

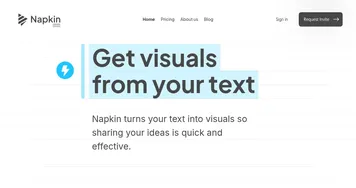
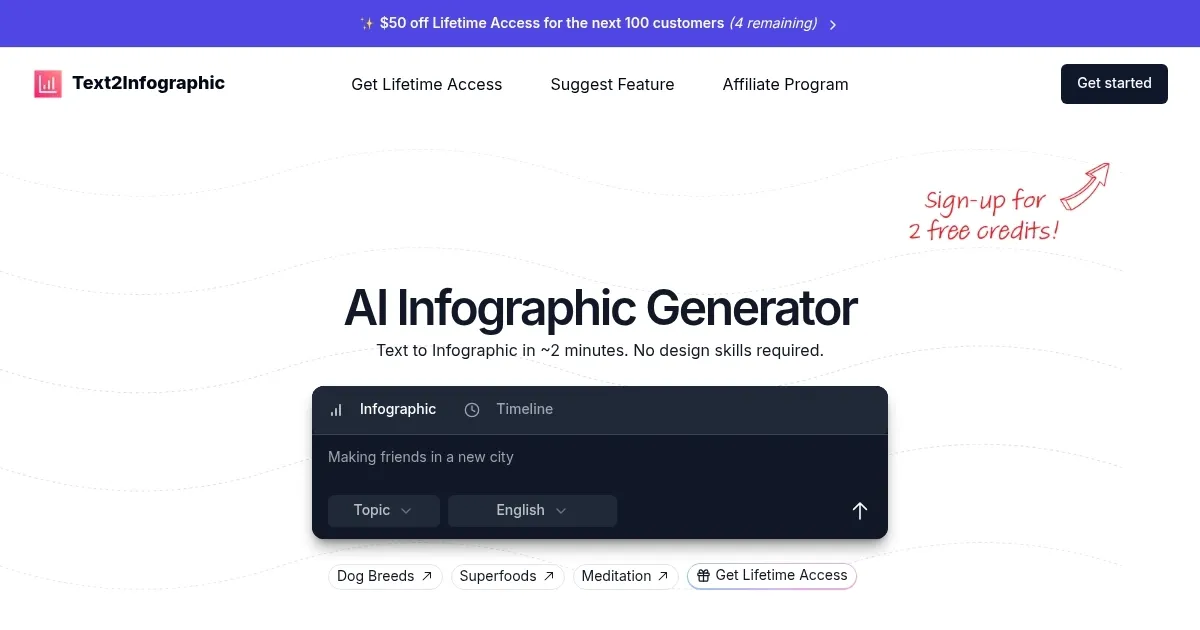
Homepage Screenshot 📸

Text2Infographic screenshot

What are the key features? ✨

  • AI Topic Research: Analyzes and summarizes provided content or topics by searching online for relevant data in seconds.
  • Auto Image Sourcing: Selects copyright-free visuals that match the infographic theme without user effort.
  • Smart Design: Generates professional layouts and structures automatically based on input hierarchies and data types.
  • Auto Citations: Includes accurate source references directly in the infographic for credibility and verification.
  • Brand Integration: Incorporates custom logos, colors, and fonts to align visuals with user branding guidelines.

Who is it for? 🤔

Text2Infographic suits bloggers and content creators who need quick visuals to boost engagement on social platforms, marketers crafting campaign graphics without design teams, educators developing visual aids for lessons, small business owners producing reports or pitches on a budget, and anyone lacking graphic skills but wanting professional outputs to communicate ideas clearly and efficiently.

Examples of what you can use it for 💡

  • Blogger: Converts a full article URL into a summarized infographic for easy sharing on Instagram or Twitter to drive traffic back to the post.
  • Marketer: Transforms campaign stats from a spreadsheet into a branded visual for email newsletters that highlights key performance metrics.
  • Educator: Generates a timeline infographic from lesson notes on historical events to use as a classroom handout or slide in presentations.
  • Small Business Owner: Creates a product comparison chart from text descriptions for website pages to help customers make informed choices.
  • Social Media Manager: Turns trending topic research into a multilingual infographic for global audiences to increase post reach and interactions.

Pros & Cons ⚖️

  • Fast 2-minute generation
  • One-time lifetime access
  • Multilingual support
  • Auto citations included
  • Commercial rights granted
  • Limited free credits
  • Customization may need tweaks

FAQs 💬

What inputs does Text2Infographic accept?
It accepts text descriptions, blog URLs, spreadsheets, Word documents, or Google Docs files for conversion into infographics.
How long does it take to generate an infographic?
Infographics generate in approximately two minutes after input submission.
Can I customize the generated infographics?
Yes, users can edit colors, fonts, images, logos, and content after the initial AI creation.
What languages does it support?
The tool supports over 20 languages for generating infographics in users preferred tongues.
Is there a free trial?
Signup provides two to three free credits to test the tool before purchasing lifetime access.
Does it include source citations?
Auto citations feature adds accurate references from researched sources directly into the infographic.
Can I use outputs commercially?
Lifetime pass includes full commercial rights for all generated infographics.
How does pricing work?
A one-time lifetime pass grants unlimited access, with no recurring fees or expiring credits.
What if the output isnt perfect?
Provide thumbs up or down feedback to improve future generations, though credits are non refundable.
Is internet required for research?
Yes, AI topic research pulls data from online sources during generation.

Ready to try Text2Infographic?

Transforms text into professional infographics in minutes

Visit Text2Infographic ↗

Text2Infographic alternatives 🔗

  1. Napkin AI Napkin AI Turn text into visually engaging content like infographics, flowcharts, and diagrams
  2. Venngage Venngage Easily create professional-quality infographics, reports, and presentations with the help of AI
  3. Visme Visme Create stunning presentations, infographics, and branded visuals effortlessly
  4. Piktochart AI Piktochart AI Transform text-heavy content into visually appealing infographics
  5. Edraw.AI Edraw.AI An innovative platform that combines AI with diagram creation
  6. Infography Infography Transforms blog posts into eye-catching infographics.
Share
Text2Infographic screenshot enlarged
Promote Text2Infographic
light badge
Copy Embed Code
dark badge
Copy Embed Code
neutral badge
Copy Embed Code
Best AI Tools

Discover the best AI tools for any use case

Explore
  • Tool Categories
  • AI Use Cases
  • AI Events
  • AI News
  • Saved Tools
Company
  • About Us
  • Contact Us
  • Media & Partnerships
  • Suggest a Tool
Legal
  • Privacy Policy
  • Terms of Service
Copyright © 2026 Best AI Tools 415 Mission Street, 37th Floor, San Francisco, CA 94105