Infography
Transforms blog posts into eye-catching infographics.
Infography is an AI-powered tool that converts blog posts, PDFs, or URLs into visually appealing infographics in seconds. It simplifies complex content into digestible visuals, ideal for boosting engagement on social media or websites. Users input a link or text, select a template, and customize with brand colors or fonts. The tool uses GPT-4o-mini for processing, ensuring accurate summarization of content. Features include API integration for automation, support for over 100 languages, and a library of customizable templates. Infography’s speed and ease of use make it a go-to for content creators.
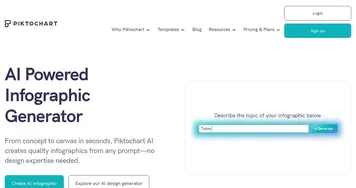
Compared to Piktochart and Infogram, Infography excels in rapid text-to-visual conversion. Piktochart offers more design flexibility but requires more effort, while Infogram focuses on data-heavy charts. Users love the intuitive interface and quick output, often creating shareable graphics in under a minute. The free plan includes limited credits, with paid tiers offering more, aligning with industry standards. Some users note the icon library feels basic, and corporate templates are limited. A standout feature is its ability to capture nuanced content accurately.
Test it with a blog post and customize the output to fit your brand before sharing.
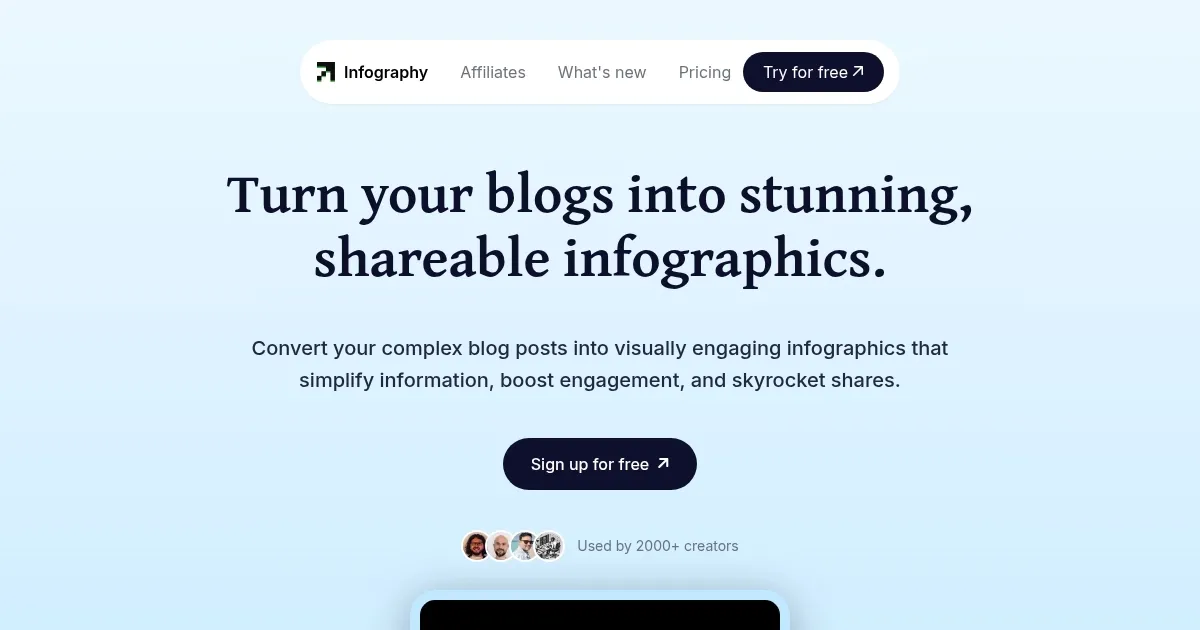
Homepage Screenshot 📸
What are the key features? ✨
- Instant Conversion: Transforms blogs or PDFs into infographics in seconds.
- Customization Tools: Adjusts colors, fonts, and logos to match brand identity.
- API Integration: Automates infographic creation for content platforms.
- Multi-Language Support: Processes content in over 100 languages.
- Template Library: Offers customizable templates for various content types.
Who is it for? 🤔
Examples of what you can use it for 💡
- Blogger: Converts a tutorial post into a visual guide for Pinterest.
- Marketer: Turns a product comparison article into a social media graphic.
- Educator: Summarizes a research paper into a classroom infographic.
- Small Business Owner: Creates a stats-driven infographic from a blog for ads.
- Non-Profit: Repurposes a report into a visual for donor presentations.
Pros & Cons ⚖️
- Fast infographic creation
- Easy-to-use interface
- Brand customization
- Affordable pricing
- API for automation
- Basic icon library
- Limited formal templates
FAQs 💬
Infography alternatives 🔗