Piktochart AI
Transform text-heavy content into visually appealing infographics
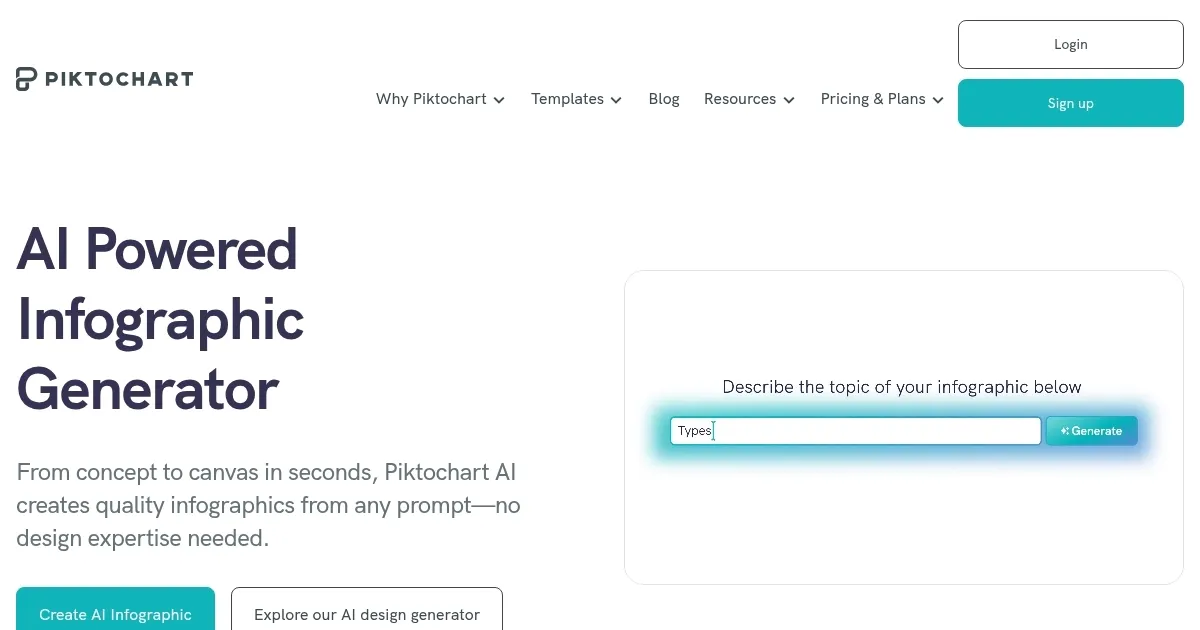
Piktochart is an easy-to-use AI tool that can transform text-heavy content into visually appealing infographics with minimal effort. By simply entering a topic or text prompt, users can generate a range of infographics templates for various subjects and themes.
Piktochart’s drag-and-drop editor allows users to customize their infographics by adding images, icons, charts, and other visual elements. This editor makes sure users can tailor their infographics to meet specific needs and preferences.
Speaking of needs, Piktochart is useful for the likes of educators, marketers, and business professionals. All of them will be able to communicate their messages more effectively, using easy-to-grasp infographics.
The tool also includes a vast library of icons, images, and fonts that could be used to make infographics better — or designed in a way that aligns with the brand identity.
In a nutshell, Piktochart aims to democratize infographic design, making it accessible to a broader audience. It is easy to use while offering advanced customization features — that further allow users to produce high-quality, visually engaging infographics. Check it out.
Homepage Screenshot 📸
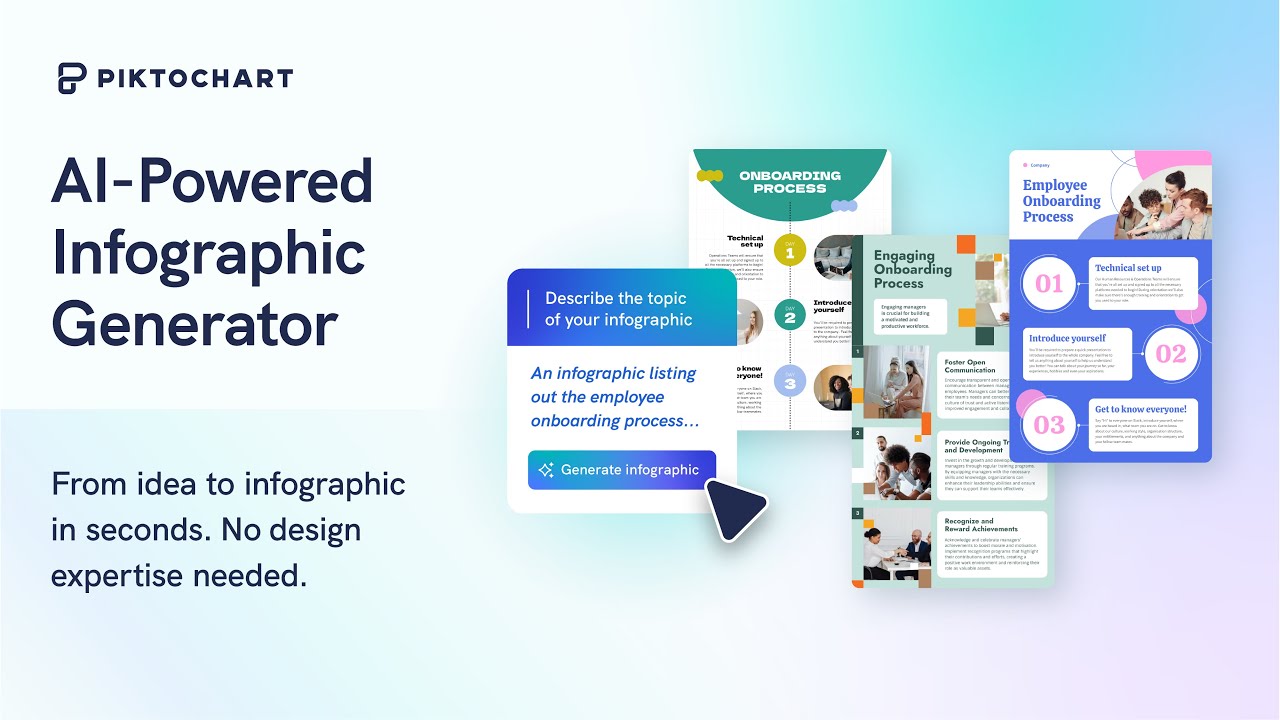
Video Overview 🎬
What are the key features? ✨
- Infographic creation: Piktochart AI allows anyone to create infographics in seconds by simply entering a topic or a subject.
- Templates: You can start with AI-generated templates and customize every element to align with your brand and message.
- Rich library: The tool provides users with access to a vast library of images, icons, and visual assets to enhance their infographics.
- Different output formats: Save and download infographics in various formats such as JPG, PNG, and PDF to make sharing and embedding easy.
- User-friendly interface: You don't need design skills to use Piktochart AI. The interface is intuitive, allowing users to create professional-quality infographics with little effort.
Who is it for? 🤔
Examples of what you can use it for 💡
- Visualize complex business data and insights in a clear way to present to stakeholders
- Transform text-heavy educational materials into interactive and visually appealing infographics
- Create compelling marketing visuals to attract and convert leads
- Develop clear and on-brand visuals for internal reports and communications to improve information dissemination
- Generate visually striking content for social media platforms
Pros & Cons ⚖️
- Makes it easy to create infographics
- Templates alone are worth the price
- And so is the included library of clipart, icons and fonts
- Not enough for Illustrator pros to switch boats
FAQs 💬
Ready to try Piktochart AI?
Transform text-heavy content into visually appealing infographics
Visit Piktochart AIPiktochart AI alternatives 🔗