Inspector
Monitors application code execution to automatically detect bugs and performance bottlenecks
Developers often chase down bugs that hide in the depths of their code, but Inspector changes that game entirely. This platform tracks every twist and turn in an application’s execution, turning what could be a frustrating hunt into a straightforward process. Users install a lightweight SDK into their codebase, and from there, Inspector captures transactions, which group related operations like HTTP requests or database queries. Each transaction breaks down into spans that detail individual steps, giving a clear view of where slowdowns or errors occur. I think this setup proves especially useful for teams handling complex systems, because it highlights problems without requiring constant manual checks.
One aspect readers might appreciate involves the zero-configuration approach. Inspector fits right into popular frameworks such as Laravel or Symfony, and it starts monitoring with minimal setup. No need for server nchanges or heavy infrastructure tweaks, which keeps things simple for smaller teams. On the flip side, those working outside supported languages like PHP or Java might find it less flexible, forcing them to look elsewhere. Compared to established players, Inspector holds its own in ease of use but lacks the broad infrastructure monitoring that Datadog provides, though it excels in code-level insights at a more predictable cost. General pricing includes a free tier for basic needs, with paid options that scale affordably, often cheaper than per-event models from competitors like New Relic.
The AI Bug Fixer stands out as a pleasant surprise. It analyzes detected issues and suggests code fixes directly in the dashboard, drawing from patterns in execution data. This feature integrates seamlessly, probably saving hours that developers would otherwise spend debugging. For instance, if a slow query pops up in a span, the tool might propose optimizations based on common best practices. Readers could like how this empowers solo developers or small groups to handle sophisticated troubleshooting without deep expertise. However, if the suggestions miss nuanced context in custom code, it could lead to trial and error, a minor drawback amid the overall efficiency.
Inspector also monitors AI agents through its NeuronAI integration, observing how agents process tasks in PHP environments. This adds value for teams building intelligent applications, as it traces agent decisions and interactions. Unlike Sentry, which focuses more on error crashing, Inspector emphasizes proactive performance tuning. Users report quick issue resolution, with testimonials noting reduced downtime. Still, integration depth varies by framework, and some might wish for broader language support.
To make the most of Inspector, start by integrating it into a non-production environment to test transaction capture. Monitor a few key endpoints, review the spans for insights, and use the AI suggestions on minor issues first. This builds confidence before rolling it out fully, ensuring your team catches problems early.
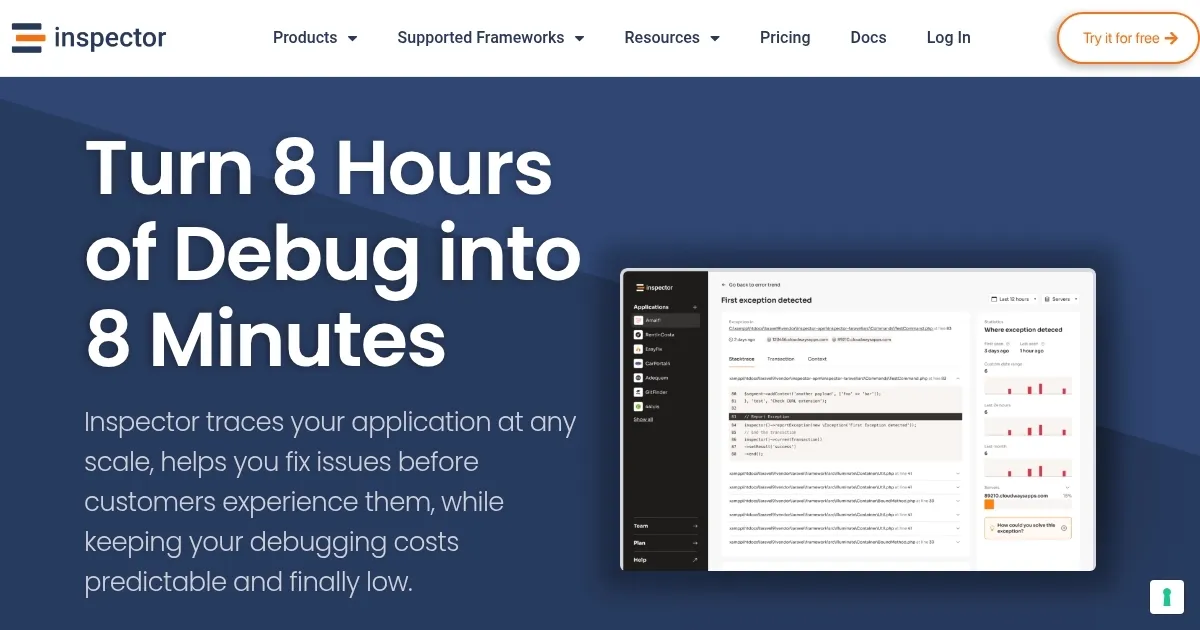
Homepage Screenshot 📸
What are the key features? ✨
- Transaction Monitoring: Tracks every execution cycle to identify errors and bottlenecks instantly.
- NeuronAI Framework: Enables building and monitoring AI agents in PHP with observability features.
- Zero-Configuration Setup: Integrates directly into code without server-level installation.
- API and Webhook Support: Connects seamlessly with external tools like Slack or custom systems.
- Real-Time Dashboard: Displays performance metrics and issues for quick debugging.
Who is it for? 🤔
Examples of what you can use it for 💡
- Laravel Developer: Uses Transaction Monitoring to pinpoint slow database queries in a web app.
- AI Startup Founder: Leverages NeuronAI to monitor and optimize PHP-based AI agents.
- Symfony Team Lead: Integrates Inspector to track performance across a multi-app project.
- Freelance Developer: Relies on the real-time dashboard to debug client projects quickly.
- Enterprise DevOps: Uses APIs to connect Inspector with internal tools for seamless monitoring.
Pros & Cons ⚖️
- Robust real-time monitoring
- Strong framework support
- Free plan is generous
- Free plan limits team size
FAQs 💬
Ready to try Inspector?
Monitors application code execution to automatically detect bugs and performance bottlenecks
Visit InspectorInspector alternatives 🔗