Highcharts GPT
Generates interactive chart code from natural language prompts and pasted data
Highcharts GPT is a part of the bigger package (tool) Highcharts, which makes it easy for developers to create charts and dashboards for web and mobile platforms. It is not really a tool for the general public, but it does work with all the popular programming languages and frameworks — including Javascript, Angular, React, VueJS, iOS, R, .NET, Python, and more.
Highcharts GPT on its end is made to make life easier for Highcharts users, allowing them to create reliable and secure data visualizations in seconds of different chart types such as line, bar, pie, and more with natural language inputs using human-like conversations.
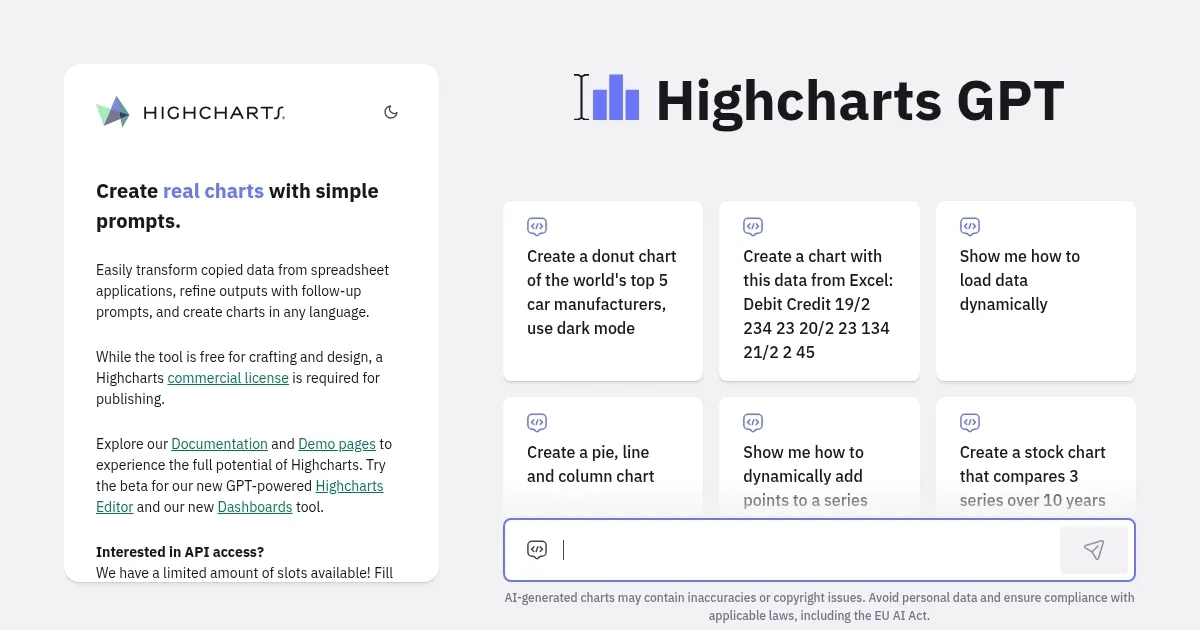
For instance, it can handle inputs like “Create a donut chart of the world’s top 5 car manufacturers,” “Show me how to load data dynamically,” “Create a pie, line and column chart,” “Create a stock chart that compares 3 series over 10 years,” “Create a Choropleth map of the United States,” and more.
Highcharts GPT is free to use, but it does require a Highcharts commercial license to publish generated charts.
Highcharts is one of the most popular charting tools, with 80 out of the world’s 100 largest companies using it for their charting. The company’s clients include BBC, Visa, MasterCard, American Express, HSBC, Samsung, Sony, and Thomson Reuters, among others.
Homepage Screenshot 📸
Video Overview 🎬

What are the key features? ✨
- Natural Language Chart Generation: Creates full Highcharts configurations and live previews from plain text descriptions of charts and data.
- Spreadsheet Data Pasting: Directly accepts copied data from Excel or similar tools to build charts without manual reformatting.
- Multilingual Prompt Support: Understands and generates charts from prompts written in various languages including German, Japanese, and Chinese.
- Follow-up Refinement: Allows users to adjust charts, add features like dark mode, or change types through ongoing conversation.
- Dynamic & Stock Chart Examples: Demonstrates code for loading data dynamically, adding points, or comparing multiple time series.
Who is it for? 🤔
Examples of what you can use it for 💡
- Data Analyst: Quickly transforms messy Excel exports into interactive line or bar charts for internal reports without writing configuration objects from scratch.
- Web Developer: Generates boilerplate Highcharts code for client prototypes, then refines styling or series via chat instead of docs hunting.
- Business User: Pastes quarterly sales data and asks for a dashboard-style combination chart to visualize trends during meetings.
- Educator: Creates multilingual teaching examples of stock charts or sine waves to demonstrate concepts in different languages.
- Product Manager: Builds mock visualizations of user metrics or A/B test results to share with stakeholders in minutes.
Pros & Cons ⚖️
- Fast code & preview generation
- Handles pasted data well
- Multilingual prompts work
- Free for design & testing
- License needed to publish
- Occasional prompt sensitivity
FAQs 💬
Ready to try Highcharts GPT?
Generates interactive chart code from natural language prompts and pasted data
Visit Highcharts GPTHighcharts GPT alternatives 🔗