MyLens AI
Helping you turn complex information into easy-to-understand visuals
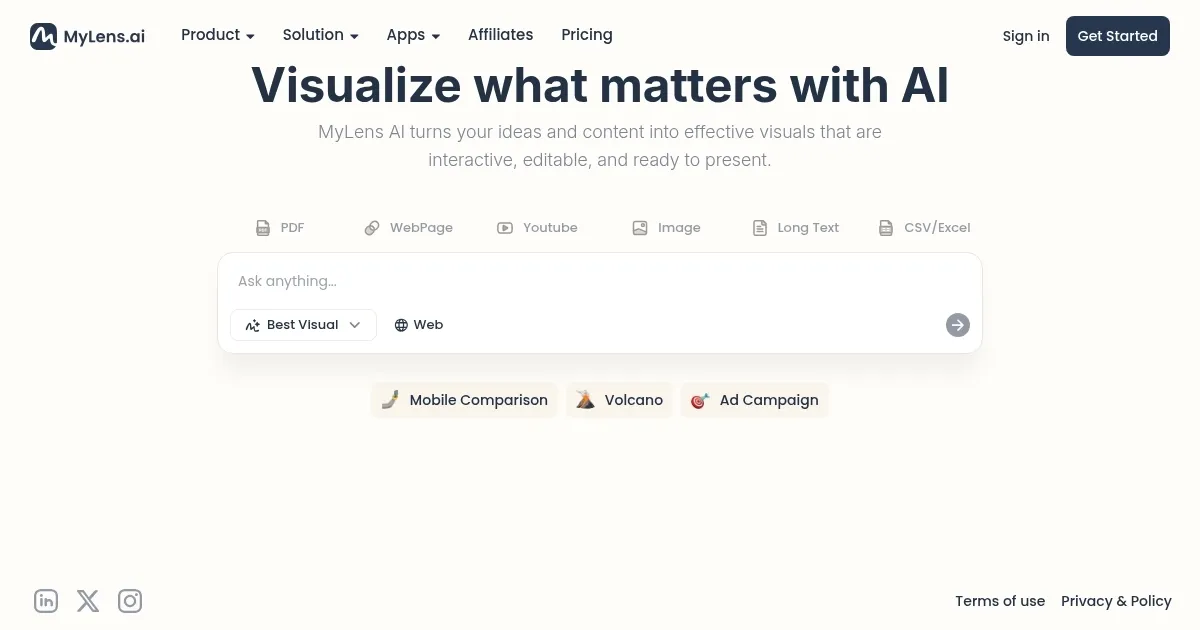
MyLens AI is a fancy tool that helps you turn complex information into easy-to-understand visuals. It can transform your data into timelines, mind maps, flowcharts, and more — making it easier to see patterns and understand your information.
Say you want to make sense of a long spreadsheet or a detailed report — yeah, it can be overwhelming. But with MyLens AI, you can upload your data and get a clear visual representation — helping you focus on what’s important and, consequently, make better decisions.
MyLens AI is useful for different kinds of users. For instance, teachers can use it to create visual aids for lessons, while students can use it to study and understand complex topics. In addition, business professionals can use it to present data to clients or colleagues.
The tool is easy to use — just upload your data, and MyLens AI will handle the rest. You can also customize the visuals to fit your needs.
Other tools like Mindmap AI, MyMemo, and Mapify can do some of this, but MyLens AI stands out because of its simplicity (though some of the other tools are not complicated, as well). As such, it is a great choice for anyone who wants to make their data more understandable.
In summary, MyLens AI is a cool tool (it rhymes) that helps you turn complex data into clear visuals. It’s easy to use and suitable for various users, from educators to business professionals. Check it out.
Homepage Screenshot 📸
Video Overview 🎬
What are the key features? ✨
- Easily visualize data: MyLens AI turns your data into visuals like timelines and mind maps, helping you better see patterns and understand your information.
- User-friendly interface: Just upload your data, and MyLens AI will do the rest.
- Customizable visuals: You can adjust the visuals to fit your needs by changing colors, layouts, and more to make your data look the way you want.
- Supports for different file types: MyLens AI works with different file types, including CSV, Excel, PDFs, and images.
- Free to try: It offers both free and paid options - you can choose the plan that fits your needs and budget.
Who is it for? 🤔
Examples of what you can use it for 💡
- Teachers and students can use MyLens AI to create visual aids for lessons and study materials
- Professionals can turn complex data into visuals for presentations to make it easier for audiences to understand
- Teams can visualize project timelines and workflows, helping everyone stay on the same page
- Analysts can use the tool to identify trends and patterns in data
- Writers and marketers can create visuals to accompany their content
Pros & Cons ⚖️
- Easy to use, even for beginners
- Supports various file types
- Customizable visuals to fit your needs
- Free plan is rather limited
Ready to try MyLens AI?
Helping you turn complex information into easy-to-understand visuals
Visit MyLens AIMyLens AI alternatives 🔗