Narrative BI
Transforms raw data into actionable insights using AI
Narrative BI steps into the analytics world with a bold promise: turn raw data into stories that anyone can understand. Growth teams, from startups to established firms, often wrestle with the chaos of data scattered across platforms like Google Analytics, HubSpot, or Salesforce. Narrative BI tackles this by pulling data into one place and spinning it into plain-English insights. No coding required. It’s a tool that feels like a translator, taking the dense language of numbers and making it conversational, even approachable. I think it’s a game-changer for teams who want to act fast on data without drowning in spreadsheets.
The platform’s strength lies in its automation. Its Automated Analytics feature gathers key performance indicators (KPIs) from multiple sources, presenting them in a unified dashboard. Natural Language Generation (NLG) is where it shines, crafting insights in clear, jargon-free prose. For example, instead of staring at a spike in website traffic, you get a sentence like, “Your landing page saw a 20% traffic increase from paid ads this week.” Anomaly Detection runs 24/7, flagging unexpected changes, like a sudden drop in email open rates. I appreciate how it doesn’t just dump data on you, it points out what matters. Scheduled Reports deliver these insights via email or Slack, saving you from manual check-ins. The Chat with Your Data feature lets you ask questions directly, like querying a colleague, and get instant AI-driven answers.
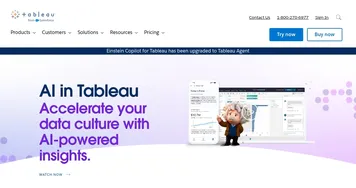
Compared to competitors like Tableau and Power BI, Narrative BI prioritizes simplicity over complexity. Tableau offers robust visualization but demands technical know-how. Power BI is powerful for enterprise-scale analytics but can overwhelm smaller teams. Narrative BI, by contrast, is built for speed and ease, especially for non-technical users. Its integrations with tools like Google Ads, Facebook Ads, and Slack make it a natural fit for marketing and sales teams. The 7-day free trial is a nice touch, letting you test the waters without commitment.
Not everything is perfect. The platform’s focus on simplicity might frustrate data scientists who crave granular control. Some users on forums like Reddit noted occasional delays in data syncing, especially with complex datasets. The interface, while clean, can feel basic compared to Tableau’s flashy visualizations. Pricing isn’t publicly detailed, but reviews suggest it’s competitive with mid-tier plans of rivals, though custom plans can add up for larger teams. A surprise perk? The platform’s ability to spot outliers — those hidden gems in your data — feels like finding a needle in a haystack without the hassle.
For teams new to analytics or strapped for time, Narrative BI is a solid pick. Start with the free trial to see if it fits your workflow. Connect your main data sources first, like Google Analytics or Salesforce, to get a feel for its narrative magic. If you need advanced customization, consider pairing it with a more robust tool like Tableau. Keep an eye on data sync times, and you’ll find this tool saves more time than it costs.
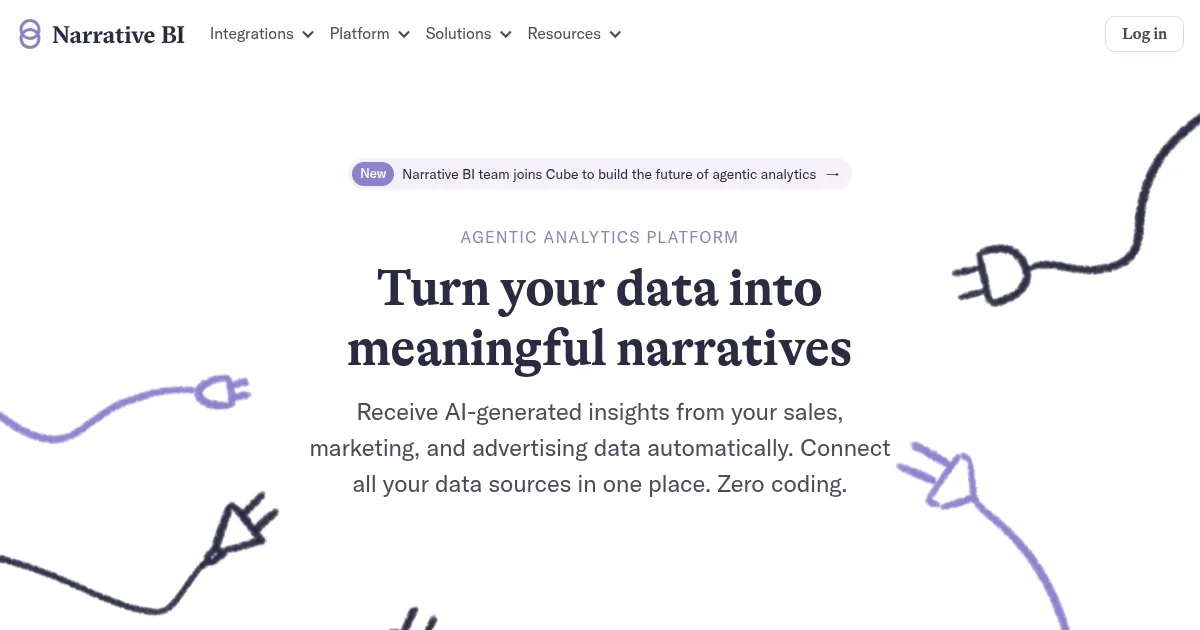
Homepage Screenshot 📸
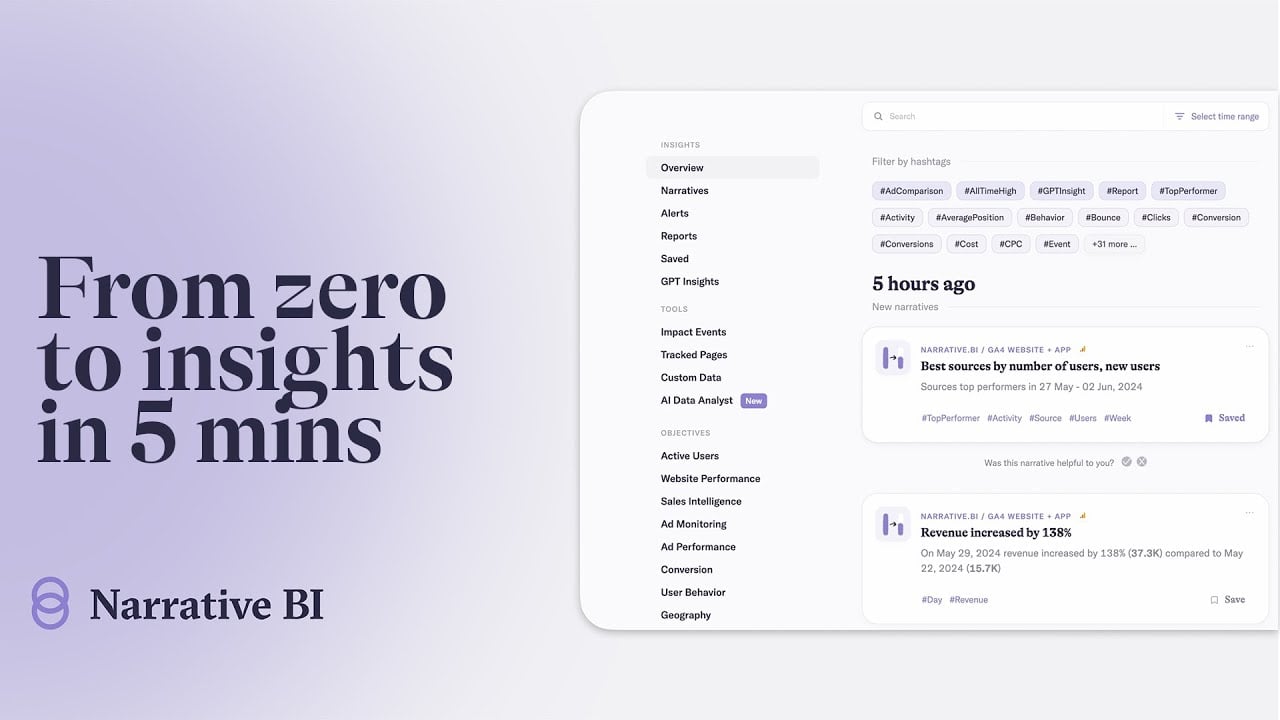
Video Overview 🎬
What are the key features? ✨
- Automated Analytics: Tracks KPIs across data sources in one dashboard.
- Natural Language Generation: Turns raw data into clear, plain-English insights.
- Anomaly Detection: Alerts users to unusual data patterns 24/7.
- Scheduled Reports: Delivers automated insights via email or Slack.
- Chat with Your Data: Allows users to query data and get AI-driven answers.
Who is it for? 🤔
Examples of what you can use it for 💡
- Marketing Manager: Uses Narrative BI to monitor campaign performance across Google Ads and Facebook Ads, identifying trends in real time.
- E-commerce Owner: Tracks website conversions and customer behavior to optimize product pages.
- Product Manager: Analyzes user data from Salesforce to prioritize feature updates based on insights.
- Small Business Owner: Reviews automated reports to understand sales trends without technical expertise.
- Agency Analyst: Shares clear, narrative-driven reports with clients to justify ad spend decisions.
Pros & Cons ⚖️
- Easy setup with no coding needed.
- Clear, plain-English insights.
- Strong integration with popular tools.
- Basic interface lacks visual flair.
- Occasional data sync delays.
FAQs 💬
Narrative BI alternatives 🔗