Kanaries
Automates exploratory data analysis and creates interactive visualizations from datasets with one click
Kanaries is an advanced AI-powered platform geared towards revolutionizing the way data analysis and visualization are approached.
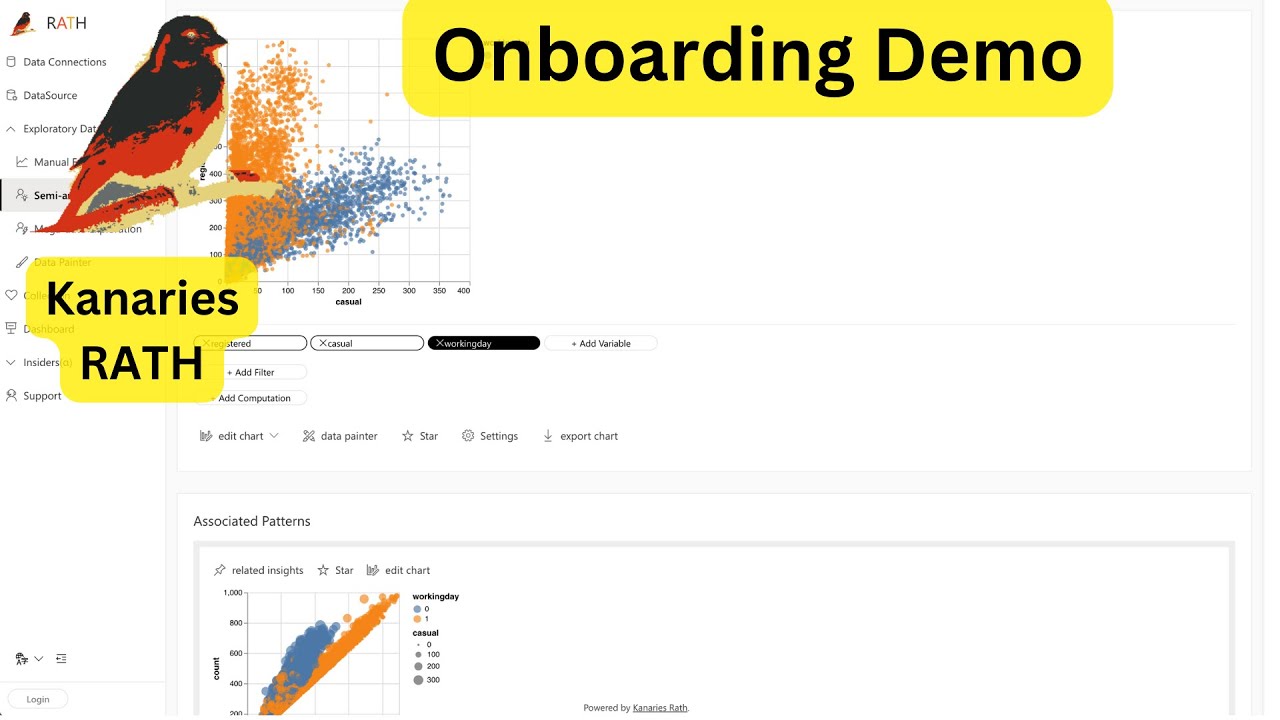
At the heart of this platform is RATH, an augmented analytic engine that automates the process of exploratory data analysis. This innovative tool is designed to assist users in effortlessly discovering patterns, insights, and causal relationships within their datasets with just a single click.
RATH is another cool feature, promising to act as a data science co-pilot by learning user intents and generating relevant recommendations.
The platform further enhances user experience through features like Data Painter, which simplifies data transformation, cleaning, and explanation into intuitive actions akin to painting — and through in-depth causal analysis to better inform prediction models and business decisions.
Kanaries aims to boost productivity by redefining workflows involved in data wrangling, exploration, and visualization through its AI-driven automation capabilities. It offers various subscription plans to cater to individual and team needs, starting from a Plus plan intended for individual users to an Enterprise scheme designed for large-scale organizational requirements.
With a focus on democratizing data analysis and enhancing team collaboration, Kanaries presents a promising suite of tools and functionalities to accommodate a wide range of data analysis tasks — thereby supporting the goal of making data insights more accessible and actionable for users of all skill levels.
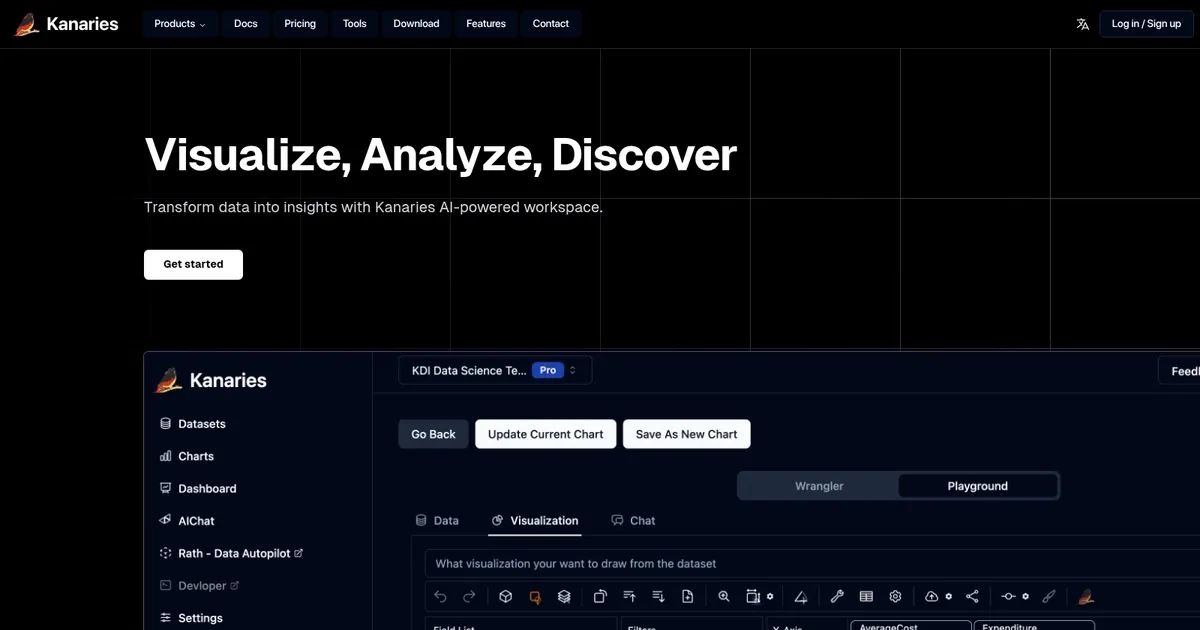
Homepage Screenshot 📸
Video Overview 🎬
What are the key features? ✨
- AutoPilot: Automatically discovers patterns, insights, and causal relationships in data with one-click exploration and visualization.
- Graphic Walker: Drag-and-drop interface for building and embedding interactive multi-dimensional charts in web apps or notebooks.
- Data Painter: Visually brush over chart areas to identify complex patterns and trigger AI-powered causal explanations.
- Copilot & Natural Language: Ask questions in plain language to generate relevant charts, insights, or recommendations from your dataset.
- Offline Desktop App: Run full analysis locally on macOS or Windows without internet or cloud dependency.
Who is it for? 🤔
Examples of what you can use it for 💡
- Data analyst: Quickly runs automated EDA on new datasets to identify key trends before building formal reports.
- Researcher: Explores survey or experimental results locally and generates causal hypotheses without uploading to cloud services.
- Marketing specialist: Analyzes campaign performance metrics and customer segments to spot opportunities in minutes.
- Python developer: Embeds Graphic Walker or uses PyGWalker inside Jupyter notebooks for interactive data exploration during prototyping.
- Small business owner: Reviews sales, inventory, or customer data offline to make faster operational decisions.
Pros & Cons ⚖️
- Strong automation saves time
- Works offline locally
- Open-source with no license fees
- Easy embedding in apps
- Performance dips on huge files
- Advanced features need learning
FAQs 💬
Ready to try Kanaries?
Automates exploratory data analysis and creates interactive visualizations from datasets with one click
Visit KanariesKanaries alternatives 🔗