Bricks
An AI-powered spreadsheet platform for data analysis, reporting, and visualization tasks
Bricks is an AI-powered spreadsheet platform designed to streamline data analysis, reporting, and visualization tasks. By integrating advanced AI capabilities, it enables users to create dashboards, reports, presentations, and various visual elements with ease — eliminating the need for extensive spreadsheet expertise. This approach allows professionals to focus on interpreting data insights rather than getting bogged down by manual data manipulation.
Bricks comes with a collection of pre-built “blocks,” which include charts, data tables, diagrams, timelines, and roadmaps. These components are designed to work with users’ data, facilitating quick and efficient creation of complex visualizations. In addition, Bricks offers a range of templates crafted by industry experts — enabling users to jumpstart their projects and maintain consistency across reports and presentations.
The platform stores user data securely on AWS, employing industry-leading data protection measures. Also, Bricks ensures that user data is never utilized for AI training purposes, the fact that provides users with confidence that their information remains confidential and protected.
The bottom line is — by combining the functionalities of spreadsheets, presentations, and reporting tools into a single platform — Bricks enhances team collaboration and productivity. Further, its AI-driven features simplify complex data tasks, making it an invaluable tool for professionals seeking to optimize their data workflows and deliver data-driven insights. Check it out.
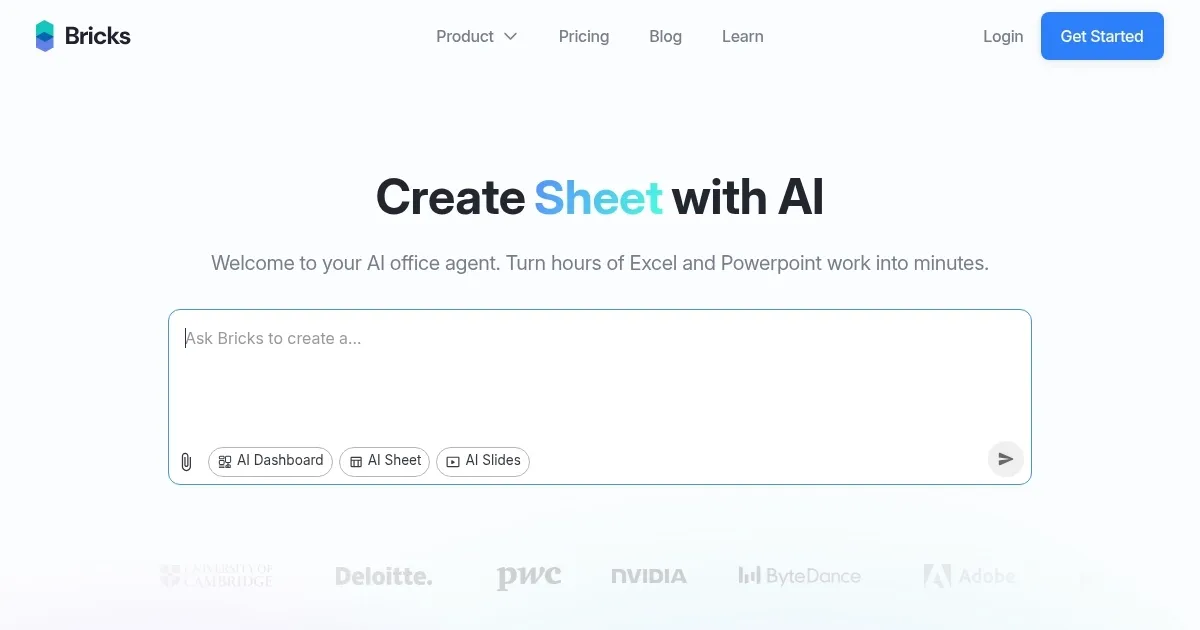
Homepage Screenshot 📸
Video Overview 🎬
What are the key features? ✨
- AI assistance: Bricks utilizes artificial intelligence to automate tasks such as formula creation, data manipulation, and data cleaning.
- Templates: The platform offers a variety of customizable templates designed by industry professionals, facilitating quick creation of reports, presentations, and other documents.
- Visualization tools: Users can seamlessly incorporate charts, timelines, roadmaps, and other visuals into their documents, all backed by their data, to enhance clarity and engagement.
- Cross-platform accessibility: Bricks is accessible on web, mobile, iPad, and desktop, allowing users to work from their preferred devices without compromising functionality.
- Data privacy & security: Bricks stores data securely on AWS with industry-leading protection measures, ensuring data is never used for AI training.
Who is it for? 🤔
Examples of what you can use it for 💡
- Generate comprehensive reports combining data analysis and visual presentations
- Teams can create and manage project timelines, roadmaps, and task lists within a single platform
- Financial professionals can utilize Bricks to analyze large datasets, create dynamic financial models, and present findings through integrated visuals
- Educators and trainers can develop interactive presentations and documents that incorporate data analysis and visualization
- Marketing teams can analyze campaign data, track performance metrics, and present insights through customized reports and visuals.
Pros & Cons ⚖️
- Combines spreadsheets, presentations, and data reports
- AI enhances data analysis and visualization
- Offers templates for various data needs
- Might require time to master for beginners
FAQs 💬
Ready to try Bricks?
An AI-powered spreadsheet platform for data analysis, reporting, and visualization tasks
Visit Bricks