Quadratic
Integrates Python, SQL, and AI to analyze and visualize data in a spreadsheet
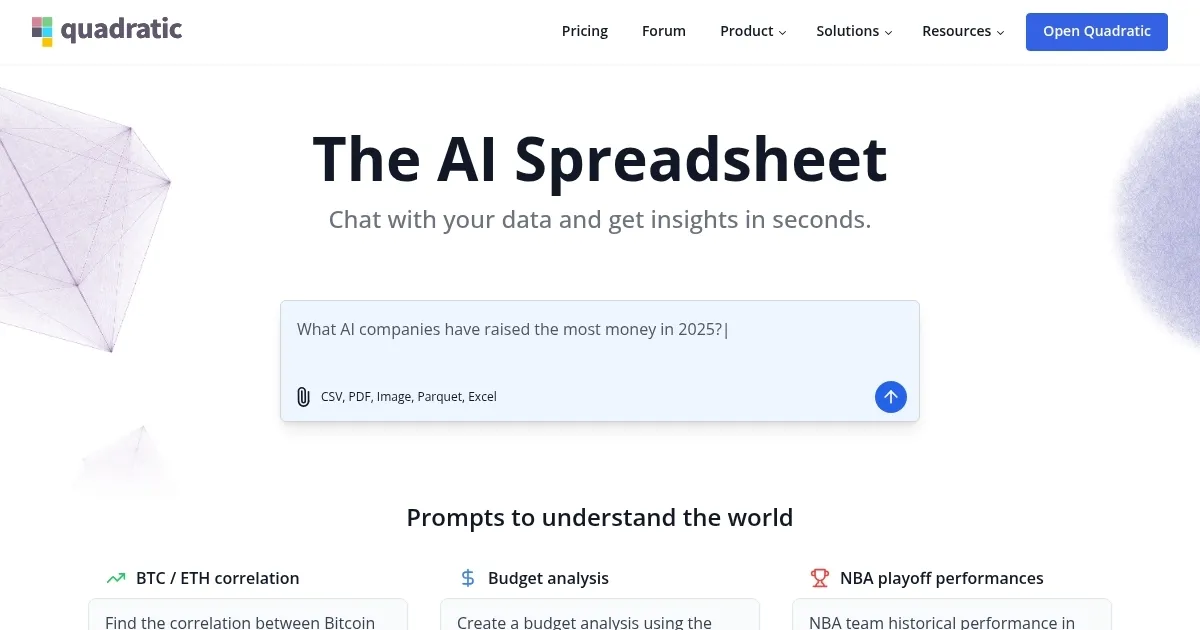
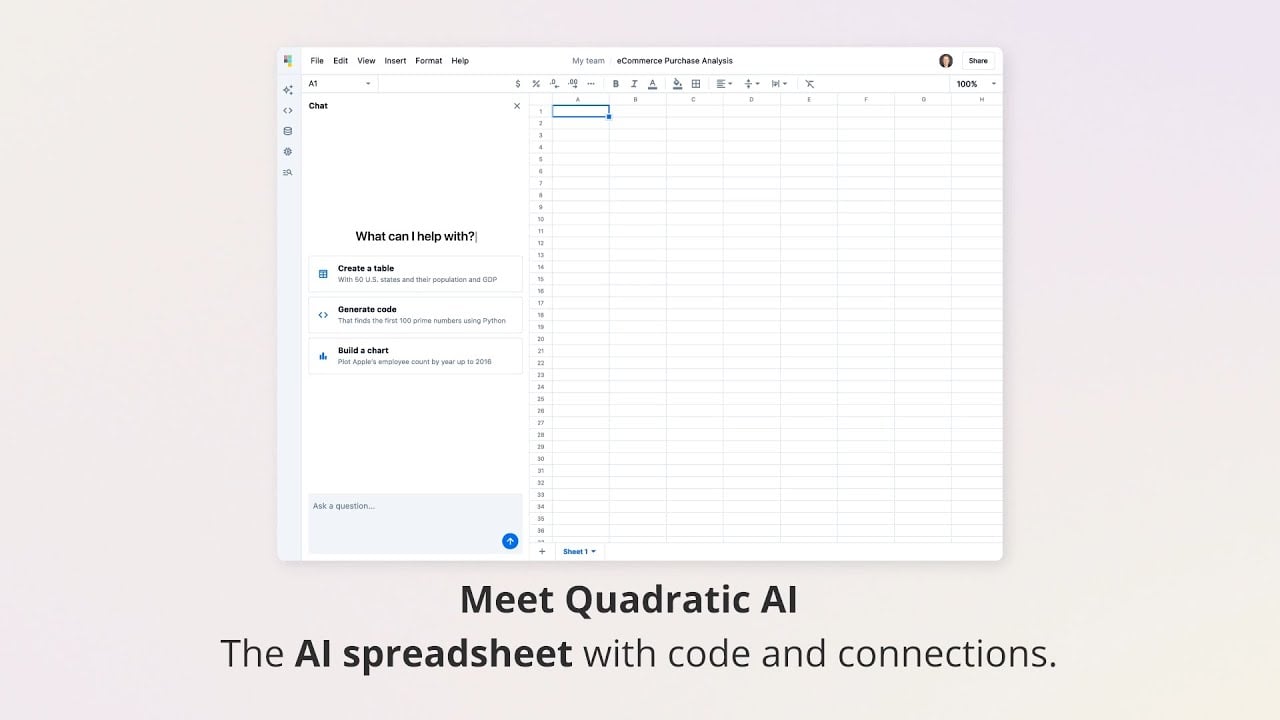
Quadratic is a browser-based spreadsheet tool that integrates Python, SQL, and AI for advanced data analysis and visualization. It combines the familiar spreadsheet interface with coding capabilities, allowing users to connect directly to data sources like databases, APIs, or CSVs. Built with Rust and WebGL, it ensures high performance, even with large datasets. Key features include AI Chat for generating code, real-time collaboration, and an infinite canvas for organizing complex projects. It supports popular libraries like Pandas and Plotly for data manipulation and charting.
The tool excels in flexibility. Users can write Python or SQL in cells, leveraging libraries to perform tasks like data filtering or predictive analytics. The AI Chat simplifies workflows by generating code from natural language prompts, ideal for users with limited coding experience. Real-time collaboration enables teams to edit sheets simultaneously, with changes syncing instantly. Integration with tools like Mixpanel or GitHub API enhances its utility for real-time analytics. The free tier offers basic access, while Pro and Team plans unlock advanced features and unlimited sharing, aligning with market standards.
Compared to Google Sheets, Quadratic offers superior coding capabilities but requires more technical know-how. Airtable is better for non-coders but lacks Quadratic’s programming depth. Tableau focuses on visualization but doesn’t match Quadratic’s coding flexibility. The interface is intuitive, though users unfamiliar with Python or SQL may face a learning curve. JavaScript support is planned but not yet available, limiting some use cases.
Quadratic’s security features, like local data storage and SOC 2 compliance, ensure data safety. The AI Chat occasionally produces code needing minor tweaks, which could frustrate beginners. Pricing is competitive, with a free plan for individuals… Check it out.
Homepage Screenshot 📸
Video Overview 🎬
What are the key features? ✨
- AI Chat: Generates code and insights from natural language prompts.
- Python and SQL Integration: Execute Python and SQL directly in spreadsheet cells.
- Real-Time Collaboration: Enables multiple users to edit spreadsheets simultaneously.
- Infinite Canvas: Provides a flexible workspace for complex data projects.
- Plotly Visualization: Creates interactive charts using the Plotly library.
Who is it for? 🤔
Examples of what you can use it for 💡
- Data Scientist: Uses Python and Pandas for advanced data manipulation.
- Business Analyst: Connects to Mixpanel API for real-time user analytics.
- Academic Researcher: Runs SQL queries for scientific data analysis.
- Startup Founder: Creates data-driven pitch visuals with Plotly charts.
- Non-Profit Manager: Analyzes large datasets for streamlined reporting.
Pros & Cons ⚖️
- Powerful Python and SQL integration
- Fast performance with large datasets
- Intuitive AI-driven code generation
- Steep learning curve for non-coders
- Advanced features require paid plans (makes sense)
FAQs 💬
Ready to try Quadratic?
Integrates Python, SQL, and AI to analyze and visualize data in a spreadsheet
Visit QuadraticQuadratic alternatives 🔗