Excelmatic
Analyzes Excel files via natural language for quick insights and charts
I grabbed a coffee one crisp morning and decided to give Excelmatic a spin, figuring I’d test it on a tangled budget spreadsheet from last quarter’s project. Nothing fancy, just a couple hours of casual poking around. The upload felt effortless, like dropping a file into a shared drive, and within seconds, I was chatting away. “Show me expenses by category,” I typed, and boom, a clean pie chart popped up, colors popping against the white screen. It was that easy, almost startling, as if the tool had been waiting for me to ask.
The data cleaning grabbed me next. My sheet had those pesky date formats mixed up, some American, some European, you know the drill. Excelmatic spotted them all, suggested a unified rule, and fixed the batch in one go. I watched the progress bar fill, sipping my brew, and thought, this beats scrubbing rows manually every time. Custom rules let me tweak for future runs, which saved me from repeating the hassle. Vividly, it felt like handing off a dirty dish to a robot washer, coming back to spotless results without the splash.
Insights came alive in ways I didn’t expect. I queried for trends in vendor costs, and it not only graphed the spikes but flagged an anomaly, a weird jump in shipping fees that I might have glossed over. “Probably a rate hike,” it noted, with a multi dimensional view breaking it down by month and supplier. Witty touch, that, like a sharp eyed colleague pointing out the obvious after you’ve stared too long. The charts updated dynamically too, as I tweaked numbers on the fly, keeping everything fresh. One clever bit. The formula assistant turned my vague “average growth rate” into a precise array setup, error free from the start.
Not everything dazzled without a hitch. The free limits hit quick during my session, cutting off mid chat after ten messages, which nudged me toward upgrading, though the pro tier seems fair for heavier use. Against Ajelix, which focuses more on formula tweaks, Excelmatic stands out for its full suite, blending cleaning and viz in one flow. Looker offers deeper enterprise ties, but it’s bulkier, while Excelmatic’s lightness surprised me, handling my mid size file without lag. Pricing tiers start free and climb affordably, often undercutting those for similar no code tools.
A fun twist emerged with the image upload. I snapped a photo of a printed table from a meeting, fed it in, and out came editable cells, ripe for analysis. That sparked a grin, turning analog scraps into digital gold on a whim. Security wise, it locks files tight, which eased my mind for work stuff. Users echo this, one calling it a time saver that feels like an extra team member. It might stumble on ultra niche stats, needing a rephrase, but for standard business crunching, it delivers sharp observations.
The interface stays conversational, pulling you in with quick responses that build momentum. I ended up chaining queries, from raw clean to final dashboard sketch, all in under an hour. It sparked ideas for my next report, making the mundane feel inventive.
Upload that nagging file you’ve been avoiding, start with a basic query on totals, and layer on visuals. You’ll build rhythm fast, and soon, those spreadsheets won’t intimidate anymore, they’ll inform.
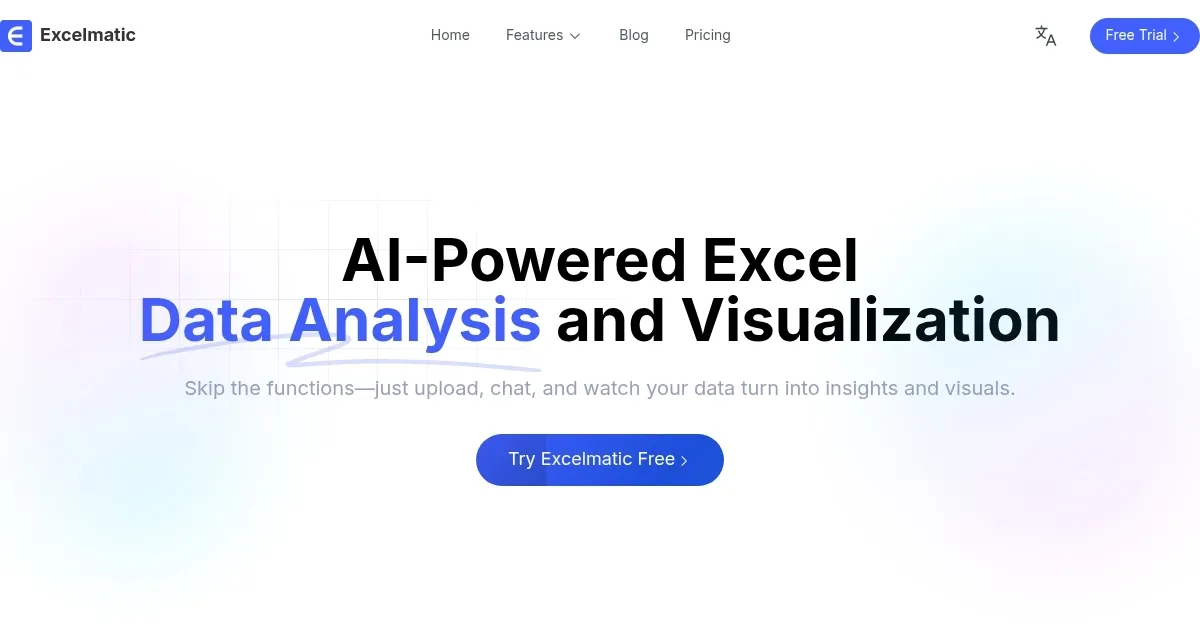
Homepage Screenshot 📸
Video Overview 🎬

What are the key features? ✨
- Natural Language Querying: Users interact with data through everyday questions to receive immediate calculations and summaries.
- Automated Data Cleaning: The tool detects formats and applies user defined rules to process multiple tables efficiently.
- Chart Generation: It creates and customizes visuals like bar and line charts that update with data changes.
- Instant Data Insights: Features include trend spotting and outlier identification for quick business overviews.
- Formula Assistant: Natural language inputs produce accurate formulas with built in error checks and fixes.
Who is it for? 🤔
Examples of what you can use it for 💡
- Marketer: Reviews ad spend data to build engagement charts and spot low performers for budget shifts.
- Small Business Owner: Cleans supplier invoices and forecasts stock needs based on past sales patterns.
- Student: Turns survey results into presentation ready graphs without memorizing chart tools.
- Financial Analyst: Scans transaction files for unusual patterns that might indicate errors or risks.
- Product Manager: Pulls user metrics into KPI dashboards for fast stakeholder updates on features.
Pros & Cons ⚖️
- Saves task time
- Simple to start
- Strong on visuals
- Free caps usage
FAQs 💬
Ready to try Excelmatic?
Analyzes Excel files via natural language for quick insights and charts
Visit ExcelmaticExcelmatic alternatives 🔗